
Linear Dicriminant Function
In this post, we will explore a class of linear functions for classification task. The goal in classfication is to take an input vector $\textbf{x}$ and to assign it to one of $K$ discrete classes $\mathcal{C_k}$, where $k$ = 1,…,K. In the most common scenario, the classes are taken to be disjoint, so that each input is assigned to one and only class. The input space is there by divided into $decision\ regions$ whose boundaries are called $decision\ boundaries$ or $decision$ $surfaces$. In linear model, the decision surfaces are linearn function of input vector $x$ and are defined by ($n$ - $1$)-dimensional hyperplanes within the $n$-dimensional input space. Data sets whose classes can be separated exactly by linear decision surface are said to be $linearly$ $separable$.
Generally, each input vector $x_i \in D$ = {$x_1$, $x_2$, $…$ ,$x_{| D |}$} is labeled with a specific class $t_1$ in classfication task. The classfication model $y(x, w)$ is given by a linear function of parameters $w$. In this case, we only consider binary classification task, that is, $t_i$ = {$0, 1$}. To generalize the linear classification model, we transform the linear function of $w$ using a nonlinear function $f(\cdot)$. . where $f(\cdot)$ could be regard as an $activation$ $function$ in machine learning literature, whereas its inverse is called a $link$ $function$ in statistics literature. This class of models are called $generalized$ $linear$ $models$.
For simplicity, we only consider binary classes. You can find the extension to K > 2 classes from Section 4.1.2.
First let me show you the simplest linear discriminant function with the input vector $x$ as follows: , where $w$ is called $weight$ $vector$, and $w_0$ is a $bias$. The neigative of bias is sometimes called $threshold$, which gets your eyeball when mentioning the $Fisher$ $Linear$ $Discriminant$ function. An input vector is assigned to class $\mathcal{C_1}$ if $y(x) \geq 0$ and, otherwise class $\mathcal{C_2}$. The decision boundary is defined by the $y(x) = 0$, which corresponds to a ($n$-$1$)-dimensional hyperplane within the $n$-dimensional space. The normal distance from origin point $x$ to decision surface is given by , where bias parameter $w_0$ determines the location of the decision surface.
Learning Algorithms
Learning algorithms are responsible for selecting the best model from hypothesis space, that is, learning the unknown parameters from the observed data. According to Bishop, the author of PRML, two typical learning algorithms can be employed to get this job done.
Least squares for classfication
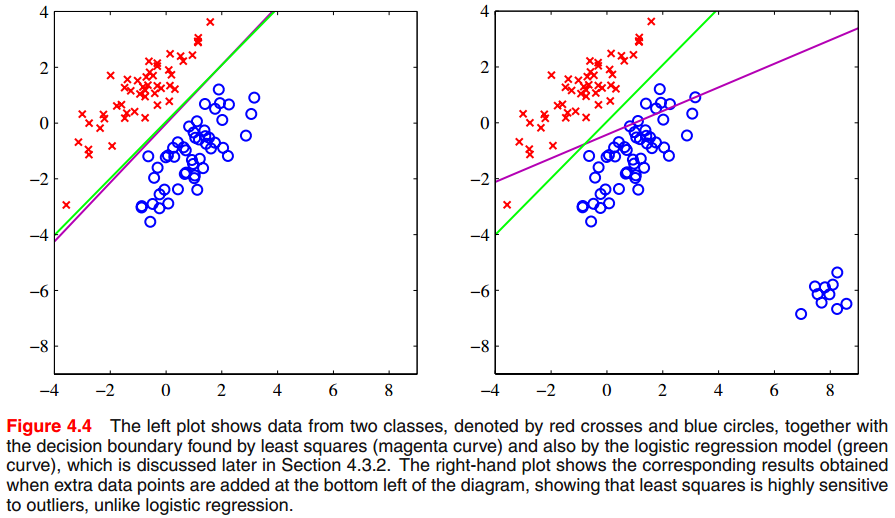
If you have less knowledge about least squares, I suggest you to review the basic idea in Chater 3, PRML. According to the denifition of least square, the sum of squares eror function can then be woritten as . Setting the derivative with respect to $w$ to zero, we then obtain the solution for $w$ in the form where $\textbf{t}$ is a vector, the $i$th element corresponds the $x_i$. The least squares approach gives an exact closed-form solution for discriminant function parameters. However, we can see that least-squares solutions are sensitive to outliers, shown in the following image.
Fisher linear discriminant
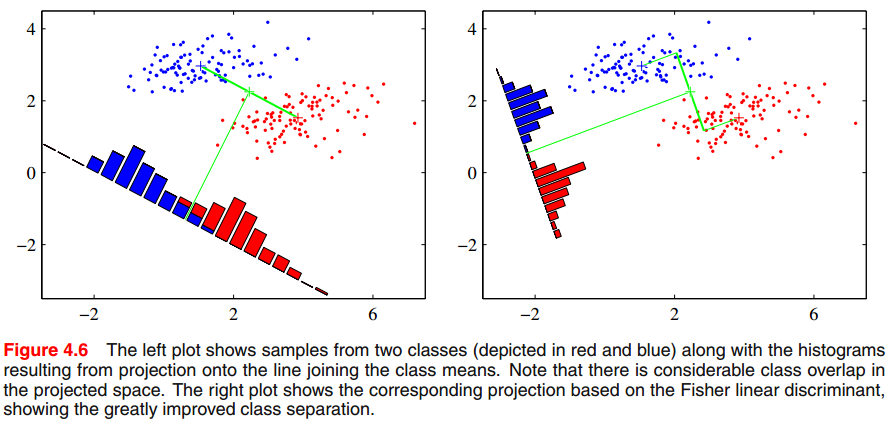
In terms of two classification cases, and suppose the $n$-dimensional input vector $x$ and project it down to on dimension using . It provides alternative perspective to understand the basic linear function. We can see that the projection onto one dimension equals to project high-dimensional point into only one point, which could lead to a considerable loss of information, and classes that are separated in the original high-dimensional space may become strongly overlapping in one dimension. This following picture offers a visual way to under this concept.
I will not given mathmatical description of the fisher linear function, since it is a special case of least squares for the two-class problem when some conditions are met, reference to Section 4.1.5, PRML. Thereby, Fisher criterion could also be sensitive to the outliers in some cases. We should carefully explore the distribution or statistical characteristics of the collected data. While I have no any experience on using fisher linear function, it’s welcome to upload your idea on commonts.